Spirulina is a microscopic and filamentous cyanobacterium. It is promoted as a ‘superfood’ that contribute to high energy levels. The important nutrients are polysaccharides and essential fats which are easily absorbed by human cells and help in energy release [1].
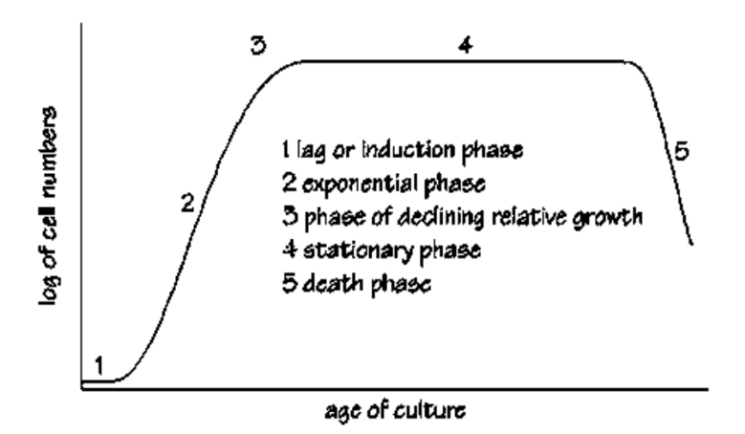
Generally, the growth of the bacteria is characterized by five stages. To maintain a healthy culture, monitoring the growth is very essential. Spirulina would grow optimally when the nutrients and light source are sufficient. The bacteria will die after the stationary phase and the debris will accumulate in the culture medium or environment.
Optical density (OD) is one of the most important parameters in Spirulina cultivation. Measuring the OD of cell growth is useful to measure the biomass concentration. Growth estimation by optical density measurement is generally determined in a spectrophotometer [2]. This application note describes a simple procedure to determine the biomass of Spirulina versus OD, using the Photopette® with any wavelength of 565 nm, 680 nm and 750 nm.
The wavelength of 565 nm was commonly used to determine the biomass concentration. The wavelength of 680 nm was used to measure the amount of chlorophyll a absorption in the Spirulina. This amount of absorbed light is proportional to the amount of Spirulina present. The wavelength of 750 nm was used to measure the apparent turbidity of the Spirulina. At 750 nm, there is no light absorption by the pigment and the measurement will correspond to the scattering of light.
Materials & Apparatus:
Instrument:
• Photopette® with 565 nm, 680 nm and 750 nm wavelengths
• Vortex machine
Reagents and materials:
• Spirulina culture
• Di water
• Filtration apparatus and filters
Method:
Before performing the experiment, it is advised to perform an application specific risk-assessment analysis before performing an experiment. Please refer to the Photopette® User Manual for operating and safety precautions [3].
EXPERIMENTAL PROCEDURE
Dry weight determination: The spirulina culture was thoroughly mixed and serially dilutions of 50 ml volume were prepared. Then the optical density of the dilutions was measured. Each serial dilution was filtered to collect the Spirulina cells on a filtration paper. The weight of all filters was taken before filtering. After the filtration the cells were washed with 20 mL Di water to remove any salt from the culture medium. The filters with the Spirulina cells were dried at 80 °C in an oven overnight. The weight of the filters with the dried Spirulina was measured with an analytical balance and the weight of the filtration paper was deducted. The dry weight of the Spirulina was then calculated. With the known volume of the culture the dry mass per volume was calculated.
OD measurements: Turn on the Photopette® Cell and connect to the Photopette® iOS/Andriod app. Select ‘All’ as the wavelengths. 565 nm, 680 nm and 750 nm will be used in the measurements. Select dataset and set additional settings (if needed) before selecting ‘Start Measurement’. Please follow the video-tutorials available at www.tipbiosystems.com to get familiar with the measurement process [4].
A CuveTip® cavity was placed firmly on the device probe and it was dipped into the blank sample (culture media) to perform auto-zero measurement. Please ensure that there is no air-bubble trapped in the CuveTip™ cavity. Presence of air bubbles disrupt the optical path and create errors. The optical density for the Spirulina culture was measured using the Photopette® Cell. The auto-measurement and the Spirulina culture measurement are measured using the same CuvetTip®. For exact results, no sample shall be transferred to the next sample. Five repeat measurements were taken for each sample.
DETERMINING CONCENTRATION OF AN UNKNOWN SAMPLE
Any Spirulina culture can be measured in a similar way and the average of measurements of 2 or 3 repeats is calculated. Using Photopette®, the biomass of the spirulina culture concentration can be calculated by substituting the value of the optical density in the equation of the standard curve. A user may use the standard curve of Figure 3 directly or prepare its own standard curve.
The results of the measurements are tabulated in Table 1.
| Cell density (gram/litre) | Optical density (OD565) | Standard Deviation (SD) |
| 0.0 | 0.00 | 0.002 |
| 0.4 | 0.30 | 0.015 |
| 0.8 | 0.73 | 0.033 |
| 1.2 | 0.92 | 0.028 |
| 1.6 | 1.01 | 0.033 |
| 3.4 | 1.27 | 0.023 |
The data was used for the generation of a standard curve, and to determine experimental parameters such as limit of detection, upper limit and linear range.
EXPERIMENTAL PARAMETERS
Upper measurement-limit and linear Range
Figure 2 shows that the readings start to saturate beyond 1.6 gram per liter. Therefore, it is not recommended to include data beyond 1.6 gram/liter in the standard curve as the measurement accuracy will be reduced. Regression analysis indicates a linear range between 0 and 1.6 gram/liter dry mass.
STANDARD CURVE
A standard curve was plotted in Figure 3 for the data within the range of 0 to 1.6 gram/liter of dry weight of spirulina.
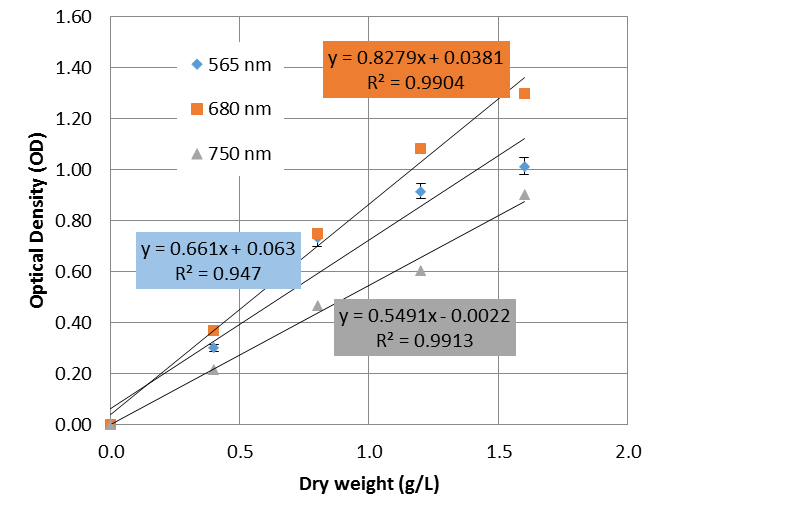
A linear regression was performed on the data using Microsoft Excel® software, and the equation of the standard curve along with its R-squared value was obtained and plotted into Figure 2.
Photopette® users may download a pre-configured worksheet for the lactate analysis from our online resource section. The worksheet is compatible with Microsoft Excel® and similar worksheet software, and will aid users in performing the calculations and generating the standard curve.
LIMIT OF DETECTION
The Limit of Detection (LOD) for this measurement using Photopette® is determined by factoring in the standard-deviation for blank measurements as well as experimental data using the equation given below:
LOD= 3 x SD blank /Slope standard curve.
Standard Deviation for blank measurements with 50 repeats using same CuveTip® was found to be 0.001 AU. Thus, the limit of detection for dry mass with Photopette® using the equation above was as below.
For 565 nm:
LOD = 3 x 0.001 OD / (0.661 OD/gram per liter)
= 0.004 gram per liter
For 680 nm:
LOD = 3 x 0.001 OD / (0.8279 OD/gram per liter)
= 0.004 gram per liter
For 750 nm:
LOD = 3 x 0.001 OD / (0.5491 OD/gram per liter)
= 0.005 gram per liter
SPIRULINA BIOMASS CALCULATION
The following example provides a calculation for the Spirulina biomass. Absorbance reading of the unknown sample from the 565 nm measurement is 0.818.
From the linear regression analysis of y=0.6608x + 0.00634, the calculated biomass by re-arranging the formula to x = (y-0.00634) / 0.6608. The biomass of the sample is 1.228 gram per liter. The same method of calculation is used for 680 nm and 750 nm. If the total culture volume is known, e.g. 6 culture barrels of 120 liter each, the total of the expected dry biomass for the Spirulina harvest can be calculated, e.g. the total volume is 6 x 120 liter = 720 liter, multiplied by 1.228 g/L gives the total dry weight of 884 gram. The wet biomass of the harvest can be calculated from the usual water content of Spirulina cells of about 90% and is ~10 times larger than the dry mass [5].
LIMITATIONS
The linear range was limited to relative low OD of up to ~1.5. Reference measurements with benchtop spectrophotometers showed similar results of limited linearity (data not shown). The range of the standard curve is not a limitation of the Photopette® device; the Photopette® can measure up to OD 3. Therefore, it is recommended to dilute your sample if the OD 565 is higher than 1.5.
Summary:
By using the method of this application note, the dry mass and expected total biomass of a Spirulina harvest can be measured within seconds. The experiment is easy to conduct and is low cost.
Download PDF version of the full article here
View our range of Photopettes https://www.apexscientific.co.za/products/?filter_brand=tip-biosystems