The food & beverage industry must make many tests and take certain measurements to ensure that their products meet high standards and are safe for consumption. The Photopette can be used for photometric measurements of liquid samples.
The objective of this application note is to demonstrate how Photopette Cell can be used to quantify the amount of ethanol in beverages on the example of wine.
Alcohol dehydrogenase (ADH) is an enzyme that catalyzes the oxidation of ethanol to acetaldehyde. At the same time, an equimolar amount of nicotinamide adenine dinucleotide (NAD+) is reduced to NADH. The amount of NADH produced is directly proportional to the alcohol concentration in the sample [1]. The produced NADH is measured by its absorbance at 340 nm. Ethanol + NAD+ Acetaldehyde + NADH + H+ This enzymatic method is applicable for beverages, food and various biological samples. Photopette® Cell at 340 nm was used to demonstrate the ethanol assay for the measurement of unknown alcohol concentrations in wine. Ethanol concentration is expressed as volume per volume percentage (v/v %), e.g. one litre wine of 12.1% will contain 121 ml of ethanol.
Instrument:
• Photopette® Cell with 340 nm wavelength
• pH meter
• Incubator (37 °C)
Reagents:
• Absolute ethanol
• NAD-ADH Reagent test vials (Sigma Aldrich, #N7160)
• 0.5 M Glycine buffer, pH 9 (made by adding 37.5 g/l glycine Sigma Aldrich #G7126 to water and adding sodium carbonate Sigma Aldrich #223530 to adjust the pH to 9)
PROCEDURE
Stock solution: A 10% v/v ethanol stock solution was first prepared by pipetting 10 mL of absolute ethanol into a 100 mL graduated flask and filling up to the 100 mL mark with Di water. Standard ethanol solutions with concentrations between 1% v/v to 8% v/v were prepared by serial dilution of the stock solution in water.
Reaction mixture: A reaction mixture was prepared by pipetting 16 mL of 0.5 M glycine buffer of pH 9 into a NAD-ADH reagent test vial. Mix the vial thoroughly by capping and inverting the vial several times (do not shake). The reagent mixture is stable for 8 hours at room temperature or 3 days at 7 °C.
Protocol: The original protocol by Sigma-Aldrich was modified for 1.5 mL reaction volume in 2 mL reaction tubes. Pipette 1.5 mL of the reaction mixture into 2 mL reaction tubes labelled BLANK, CALIBRATION and SAMPLE. Pipette 5 L of Di water into the ‘BLANK’ reaction tube; pipette 5 L of the standard ethanol solutions into the CALIBRATION reaction tubes and 5 L of sample into the SAMPLE tubes. Incubate all reaction tubes for 10 minutes at 37 °C. Cool down to room temperature and complete all measurements within 10 minutes.
Turn on the Photopette Cell device and connect to the Photopette iOS/Android app. Refer to the “Photopette User Manual” for operating and safety precautions [2]. Select ‘340 nm’ as the wavelength. Select dataset and set additional settings (if needed) before selecting ‘Start Measurement’. Please follow the video tutorials available at www.tipbiosystems.com to get familiar with the measurement process.
Place a CuveTip firmly onto the Photopette® device probe and insert into the blank sample to perform auto-zero. Ensure that there is no air-bubble trapped in the CuveTip cavity. Presence of air bubbles may disrupt the optical path and cause errors. A guide to use the CuveTip correct is available as download [3]. Use the same CuveTip to measure the standard ethanol solutions from low to high ethanol concentrations. Ensure that there is no liquid transferred between samples by contacting the CuveTip with a tissue paper and remove any liquid by capillary action. Repeat the procedure for the samples with unknown ethanol concentration.
DETERMINING CONCENTRATION OF AN UNKNOWN SAMPLE Depending on the estimated unknown ethanol concentration of the sample, prepares several dilutions, e.g. 1:10 dilution for wine and 1:1 dilution for beer. Serum, plasma and urine require no dilution. Use the dilutions as duplet or triplet samples as explained above. The ethanol concentration is calculated by substituting the absorbance value obtained into the equation of the standard curve and factoring in the dilution factor.
Results:
Table 1 below shows the obtained absorbance values at 340 nm as a function of the ethanol concentration of ethanol standard solutions.
| Concentration of ethanol standards (v/v %) | Average Absorbance (AU) | Standard deviation (SD) |
| 0.0 (blank) | 0.00 | 0.001 |
| 1.0 | 0.24 | 0.000 |
| 1.5 | 0.46 | 0.002 |
| 2.0 | 0.63 | 0.005 |
| 2.5 | 0.76 | 0.004 |
| 3.0 | 0.94 | 0.004 |
| 4.0 | 1.03 | 0.003 |
| 6.0 | 1.26 | 0.012 |
| 8.0 | 1.40 | 0.001 |
Table 1: Absorbance values of the prepared ethanol standard solutions (auto zero performed in blank).
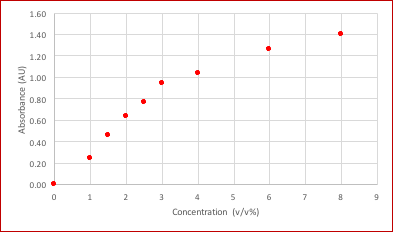
The data of the ethanol dilution series was used for the generation of a standard curve and to determine experimental parameters such as limit of detection, linear range and linearity. The absorbance values in Table 1 were plotted in Figure 2 below.
EXPERIMENTAL PAPRAMETERS
Linear range
Figure 2 shows that readings above 3% v/v are not linear as indicated by the blue dotted line. The limited linearity may be caused by a limited amount of NAD+ in the reaction mixture or by an uncomplete enzymatic reaction or both.
STANDARD CURVE
A standard curve was plotted in Figure 3 for the data within the linear range of 0% v/v to 3% v/v. A linear regression was performed on the data using Microsoft Excel® software. The equation of the standard curve in Figure 3 has an R-squared value of 0.9929. The slope of the standard curve obtained was 0.3193 AU/v/v%.
Photopette users may download a pre-configured worksheet for the ethanol analysis from our online resource section. The worksheet is compatible with Microsoft Excel® and similar worksheet software and will aid users in generating the standard curve. It is advisable to prepare a complete standard curve with at least 5 data points (ethanol concentrations) and a blank for the first measurement to confirm linearity. For follow up measurements, it is advised to run one or two ethanol standards together with the unknown samples.
EXPERIMENTAL VARIATIONS
The same measurement procedure can be used to determine ethanol concentrations in other samples such as various beverages, food and biological samples including serum, plasma and urine. For strongly colored samples the absorbance at 340 nm must be taken into account and corrected for. Non-liquid and turbid samples need ethanol extraction and/or filtration before the assay can be performed.
LIMITATIONS
ADH will also react with certain higher aliphatic alcohols. The highest activity is found for ethanol, n-Butanol has about 40% and isopropanol about 8% of activity compared to ethanol (100% activity). The activity for secondary and branched chain alcohols is negligible.
Summary:
This application note is a simple guide to determine ethanol concentrations of unknown samples by measuring the absorbance at 340 nm with Photopette. The enzymatic based assay takes less than 30 min to perform. The method can be easily adapted by breweries, analytical laboratories or for school experiments.
Download full PDF version of this Article here
View our range of Photopettes