Determining Turbidity of an aqueous solution is a frequently used procedure to estimate the quality of water, or even concentration of suspended particles such as cells, bacteria and mud.
Turbidity can be defined as a decreased in the transparency of a solution due to the presence of suspended and some dissolved substances, which causes incident light to be scattered, reflected and attenuated rather than transmitted in straight lines; the higher the intensity of the scattered or attenuated light, the higher the value of turbidity [1].
Nephelometric turbidity units (NTU) are often used to express turbidity. NTU can be defined as the intensity of light at a specified wavelength scattered or attenuated by suspended particles or absorbed at a method-specific angle (90 degrees), from the path of the incident light compared to a synthetic chemically prepared standard [1].
Following the USEPA method and ISO 7027 method, the turbidity is measured at wavelengths of 570 nm and 850 nm respectively. This application note highlights the measurements of OD at these two wavelengths using the Photopette.
Instruments:
• Photopette® custom with 570 nm and 850 nm wavelengths.
Turbidity 4000 NTU Calibration Standard – Formazin (Sigma Aldrich #TURB4000)
• De-ionized water
Method:
EXPERIMENTAL PROCEDURE
Turn-on the Photopette device and connect to the Photopette iOS/Android app. Refer to the “Photopette User Manual” for operating and safety precautions [2]. Select ‘Turbidity’ as the measurement type. Select dataset and set additional settings (if needed) before selecting ‘Start Measurement’. Please follow the video-tutorials available at www.tipbiosystems.com to get familiar with the measurement process.
Place a CuveTip firmly onto the Photopette device probe and insert into the blank sample to perform auto-zero. Ensure that there is no air-bubble trapped in the CuveTip cavity. Presence of air bubbles may disrupt the optical path and cause errors. A guide to use the CuveTip correctly is available for download [3]. Use the same CuveTip to measure the turbidity standard solutions from low to high concentrations. Ensure that there is no liquid transferred between samples by contacting the CuveTip with a tissue paper and remove any liquid by capillary action. The prepared formazin solutions with varying turbidity formazin solutions were vortexed to ensure a uniform mixing before dilution or measurement. The formazin solutions were measured immediately after vortex-mixing using Photopette device. The same procedure was repeated for the sample with unknown turbidity (NTU).
DETERMING CONCENTRATION OF AN UNKNOWN SAMPLE
Depending on the estimated unknown turbidity (NTU), prepare several dilutions. Use the dilutions as duplet or triplet samples as explained above. The turbidity (NTU) is calculated by substituting the OD value obtained into the equation of the standard curve and factoring in the dilution factor.
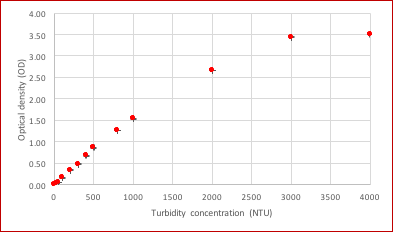
Table 1 below shows the obtained OD values at 570 nm as a function of the turbidity standard solutions
| Formazin Standard (NTU) | Average OD at 570 nm (OD) | Standard Deviation (SD) |
| 4000 | 3.50 | 0.000 |
| 3000 | 3.44 | 0.010 |
| 2000 | 2.67 | 0.005 |
| 1000 | 1.54 | 0.008 |
| 800 | 1.26 | 0.005 |
| 500 | 0.86 | 0.009 |
| 400 | 0.68 | 0.005 |
| 300 | 0.49 | 0.003 |
| 200 | 0.35 | 0.002 |
| 100 | 0.16 | 0.003 |
| 50 | 0.05 | 0.001 |
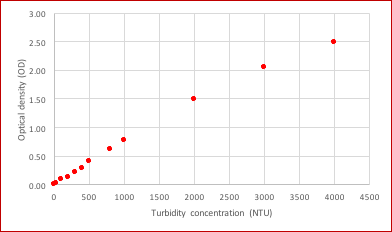
Table 2 below shows the obtained OD values at 850 nm as a function of the turbidity standard solutions.
| Formazin Standard (NTU) | Average OD at 850 nm (OD) | Standard Deviation (SD) |
| 4000 | 2.49 | 0.010 |
| 3000 | 2.06 | 0.010 |
| 2000 | 1.48 | 0.012 |
| 1000 | 0.77 | 0.004 |
| 800 | 0.62 | 0.002 |
| 500 | 0.41 | 0.020 |
| 400 | 0.29 | 0.004 |
| 300 | 0.23 | 0.004 |
| 200 | 0.13 | 0.006 |
| 100 | 0.09 | 0.010 |
| 50 | 0.00 | 0.001 |
The data obtained in Table 1 and 2 were used for generation of standard curves, and to determine experimental parameters such as upper measurement-limit, limit of detection and linear range. The OD values in Table 1 were plotted in Figure 1 and the data from Table 2 were plotted in Figure 2.
EXPERIMENTAL PARAMETERS
Upper measurement-limit and Linear Range
From Figure 1, we can deduce that the readings tend to saturate beyond 1000 NTU (indicated by the dotted line). Therefore, it is not recommended to include data beyond 1000 NTU in the standard curve as the measurement accuracy will be lower. Regression analysis indicates the linear range to be 50 NTU to 1000 NTU solution. The OD of 50 NTU prepared standard is below the recommended specification of the Photopette Device. Thus, it was not included for further preparation of standard curve.
From Figure 2, we can deduce that the readings tend to saturate beyond 2000 NTU. Regression analysis indicates the linear range to be 200 NTU to 2000 NTU solution. The OD of 200 NTU prepared standard is below the recommended specification of the Photopette Device. Thus, it was not included for further preparation of standard curve.
STANDARD CURVE
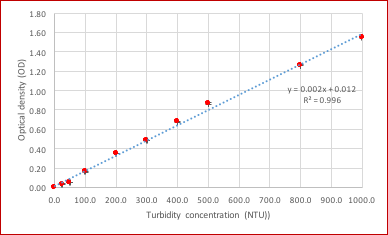
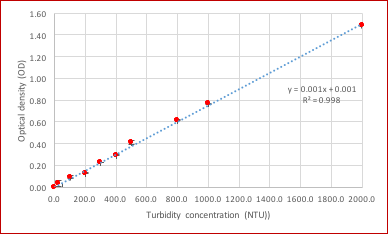
A standard curve was plotted in Figure 3 for the measurements obtained at 570 nm within the linear range of 50 NTU to 1000 NTU. Similarly, a standard curve was plotted in Figure 4 for the measurements obtained at 850 nm within the linear range of 200 NTU to 2000 NTU. A linear regression was performed on the data using Microsoft Excel software. The equation of the standard curve in Figure 3 has a R-squared value of 0.9954 and in Figure 4, a value of 0.9982. The slope obtained was 0.0016 AU/NTU and 0.0007 AU/NTU in Figure 3 and 4 respectively.
Limit of Detection
The Limit of Detection (LOD) for this assay using Photopette is determined by factoring in the standard-deviation for blank measurements as well as experimental data using the equation given below:
LOD = 3 x SDblank / Slope(Standard Curve)
Standard Deviation for blank measurements with 50 repeats using same CuveTip was found to be 0.003 AU and 0.001 AU for 570 nm and 850 nm respectively.
For 570 nm: LOD = 3 x (0.003 OD) / (0.002 OD/NTU)
≈ 4.5 NTU
For 850 nm: LOD = 3 x (0.001 OD) / (0.001 OD/NTU)
≈ 3 NTU
DETERMINING UNKNOWN TURBIDITY OF SAMPLES
For 570 nm, a water sample was collected and the average of triplets resulted in an OD of 0.591. The linear regression of the turbidity standards of Figure 3 is:
y= 0.002 x + 0.0221
Re-arranging the “x” in the equation results in:
X = (y -0.021)/0.002
Inserting the OD of the unknown sample results in
X = (0.591 -0.021)/0.002
X = 285 NTU.
For 850 nm, a water sample was collected and the average of triplets resulted in an OD of 0.257. The linear regression of the turbidity standards of Figure 4 is:
y= 0.001x + 0.001
Re-arranging the “x” in the equation results in:
X = (y -0.001)/0.001
Inserting the OD of the unknown sample results in
X = (0.257 -0.001)/0.001
X = 256 NTU.
LIMITATIONS
Suspended particles in a turbid solution may tend to settle down. Therefore, it is very important the solution is well-mixed and the readings are taken as soon external agitation is removed.
Summary
The application note guides the user for determining turbidity of an unknown aqueous samples. It highlights experimental parameters such as limit of detection and upper measurement-limit and linear range for such measurements as well using Photopette device.
View range of photopettes here