Download this Application Note as PDF File here: AN018 – Photopette for COVID19 related Cell Culture Research
Dr. Dieter Trau and Dr. Shihao Li, Tip Biosystems Pte Ltd, Singapore and E3A Healthcare Pte Ltd, Singapore
– Photopette® will accelerate your cell culture work; perform cell counts and more within the cell culture hood in seconds.
– By using the “Method Maker” function of the Photopette app, an accurate calibration can be made for any cell line.
Objective:
Here we demonstrate how Photopette® can be used within the cell culture hood to speed up COVID-19 related cell culture research. Determine cell densities, protein and DNA/RNA concentrations within seconds without any sample transfer and perform cell viability studies. Use of the Photopette directly in the culture hood becomes very practical if working in biosafety regulated areas. Due to biosafety levels, it may not be possible to bring samples out of the culture hood or a culture room. With the Photopette, measurements can be done directly without the operator leaving his workplace [1].
Introduction:
In the fight against COVID-19, research will be at the forefront to understand the molecular mechanisms of the viral infection, the interaction of the virus with mammalian cells and to develop vaccines and drugs. All those studies will require cell culture work on a large scale. Here the Photopette comes in to support the researcher.
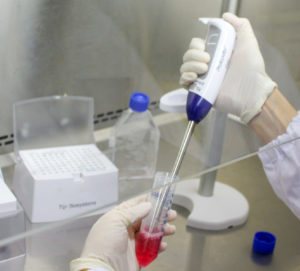
The Photopette is an ergonomic handheld spectrophotometer that can be used directly within the cell culture hood as seen in Fig 1. With the Photopette the researcher can perform cell density, protein and DNA concentration measurements within seconds, without leaving the cell culture hood.
Other studies such as cell viability are possible as well. All at the confined space of the cell culture hood. Without wasting time to transport samples to other labs and instruments. Photopette greatly improves the work of COVID-19 researchers, it saves time and reduces contamination risk.
Materials & Apparatus:
Instruments:
– Photopette® Bio (260, 280, 340 nm), Photopette® Cell (340, 570, 600 nm), Photopette® OD600 (600 nm). Sterile CuveTip TM
– Optical microscope and hemocytometer
Cell lines:
– Any cell lines required in COVID-19 research. Certain experiments in this application note were conducted with Hella Cell lines.
– Protein and/or DNA/RNA samples
Methods:
The following methods can be performed conveniently and fast within the cell culture hood:
– Cell density of various cell lines used in COVID- 19 related research.
– Protein, DNA/RNA concentration measurements.
– Cell viability studies.
PHOTOPETTE AND SOFTWARE APP
For all measurements listed above, turn-on the Photopette ® device and connect to the Photopette ® iOS/Android app via Bluetooth. Under “Measurement Type” select the application you would like to perform, such as cell density or protein concentration. Select dataset and set additional settings (if needed) before selecting ‘Start Measurement’.
Please refer to the video-tutorials on the Tip Biosystems webpage at www.tipbiosystems.com to get familiar with the measurement process and read our technical note “HOW TO USE PHOTOPETTE® AND ITS DISPOSABLE CUVETIP® CORRECTLY” available at the Tip Biosystems webpage [2,3].
After selection of “Measurement Type”, an AUTOZERO must be performed first by using a BLANK. The blank sample can be sterile double distilled water or alternative the cell culture media (without cells present) or the respective buffer. To start the measurements, A CuveTip TM is placed firmly onto the device probe and dipped into the blank sample to perform the auto-zero measurement. Please ensure that there is no air bubble trapped in the CuveTip TM cavity. Presence of air-bubbles may disrupt the optical path and cause errors. Then the measurement is performed using the same tip (higher accuracy) or a new sterile tip by inserting the tip into the measurement solution (e.g. directly into a cell culture flask) and press “Measurement”. The result is displayed in the app. The data obtained with the Photopette can be easily shared via cloud upload, emailed or loaded into Microsoft applications for further analysis.
1st APPLICATION – CELL DENSITY MEASUREMENT
By using Photopette devices with 600 nm wavelengths such as the Photopette Cell or Photopette OD600 cell density measurements can be performed within seconds.
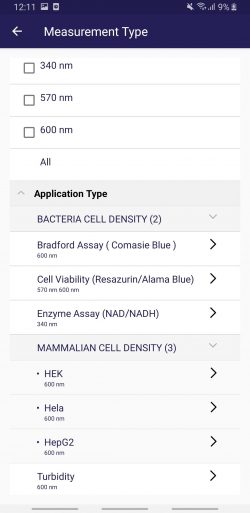
Factory calibrated cell lines: After connecting with the Photopette APP, go to “Measurement Types”. The App will show several factory calibrations of mammalian cells, bacteria and yeast (Fig 2). Depending on which Photopette device is connected, such as Bio, Cell, OD600, the App will automatically show all supported applications.
Just choose one of the cell lines, pick up a CuveTip, perform the blank, preferentially in the sterile cell culture media and directly measure the cell density in the cell culture flask. The reading directly gives you the cell number per volume. The entire process takes less than a minute. It’s advisable to use Tip Biosystems sterile CuveTip. The device stem of the Photopette is made from high grade stainless steel and can be sterilized by whipping with 70% ethanol. The Photopette housing can be wiped with ethanol as well.
If there is no existing factory calibration of the cell line you are using, you have two options:
1) Chose a factory calibrated cell line that is close to the properties to the cell line you are using, e.g. in cell diameter. However, this option will give you an error in the results.
2) Perform your own calibration. With this option you will obtain highly accurate results. You only need to perform the calibration once. The calibration will be stored in your mobile device. The calibration process is explained in the following.
Make your own custom calibration of any cell line: This is the best way to obtain highly accurate cell density results from any cell line. In this example we have chosen HeLa cells to demonstrate the calibration process. The method is based on the calibration against another method to determine exact cell numbers and then measure the optical density OD600 in the same samples. Here we use the method of cell number counting with a hemocytometer.
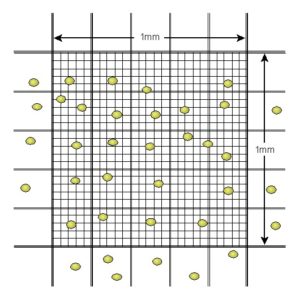
First, prepare a suspension of your cell line in the relevant cell culture media. From the stock solution, with high cell numbers in the range of 1 to 6 million cells per mL, prepare a dilution series. In our example, a total of 9 cell suspension are prepared with known dilution factors. Number the samples from 1 to 9 with sample 1 the highest cell density. Start the Photopette App and create a new dataset, you may give the dataset a name such as “cell data”. Choose the wavelength 600 nm. After performing the blank in the cell culture media, use the same CuveTip to measure the OD600 in all 9 samples. This data is now stored in your dataset “cell data”. In the next step you need to use a reference method such as using a hemocytometer to measure the cell number in selected samples from your 9 samples. In the standard hemocytometer, the volume between the cover slide and the counting grid is 0.1 mm3. It is recommended that you count at least 20 but not more that 100 cells within the grid (Fig 3). If your cell number is to low or to high, use another sample from the dilution series. In the example of Figure 3 below, 24 cells are counter within the grid, resulting in a cell density of 24 cells per 0.1 mm3 or 240 cells/μL or 240,000 cells/mL. You may count more than one of the samples from the dilution series to get more reliable data.
From the known dilution factors, calculate the cell numbers in all 9 samples of the dilution series. Write down the sample number from 1 to 9 and the respective cell numbers and correlating OD600 into a table.
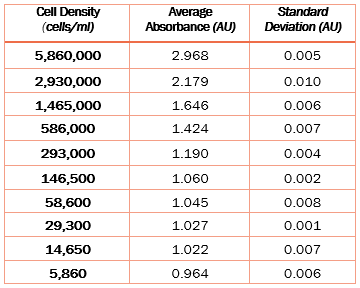
For our example we used the disposable hemocytometer INCYTO™ C-Chip™ together with an Olympus BX series optical microscope to measure cell numbers and tabulated them in the Table 1 below. Only one sample was measured several times and all other cell numbers calculated from known dilution factors.
Now you are ready to use the “Method Maker” function of the Photopette APP to create your calibration. Start the Photopette APP. Click on “Method Maker” in the function bar at the button of the APP, the following window will open.
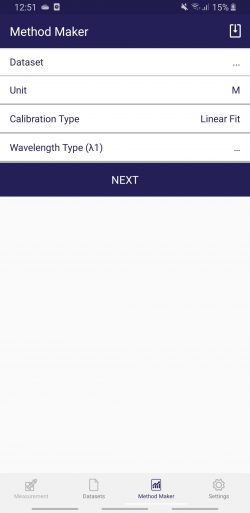
The Method Maker can be used without the Photopette connected to the APP. The creation of your custom method is fast and simple:
– Click on “Dataset” and chose your dataset “Cell Data” with your OD600 measurement results. The wavelength will be automatically selected by the “Method Maker” function as its also stored in the dataset file.
– Click on “Unit”, then click on “USER DEFINED”. You can create any custom unit you want. In our example you may create “Cells/microliter or Cells/mL”, then click “OK”.
– Click on “Calibration Type” and chose which type of mathematical fit you want to select. In general, OD600 results from cells will not behave strictly linear. Remember, cell density measurements rely on the scattering of light and do not follow the Lambert-Ber law. For larger dynamic range (measurement from very low to very high cell density) you may choose “Quadratic Fit” from the list.
– Click “NEXT” and a new window showing a table will open. In the left column you will see your OD600 measurements “600 nm” and in the right column under your used defined unit, e.g. “Cells/mL” you will see fields to fill in data marked as “Fill in Data”. In our example, the Absorbance data as shown in Table 1 will be displayed in the left column.
– Refer to your table (similar to Table 1) and fill in the corresponding cell numbers into the fields “Fill in Data” in the right column. You can also deselect fields if necessary, e.g. if the data is an outlier. Then click “NEXT”.
– A new window will open that displays the graph of your calibration curve. It will also display the quadratic fit formula and the R-Square Value of your fit.
– Under “Method Name” fill in a name for your new method. This will be the same name which is later displayed under “Measurement Type”. Chose the group under your method should appear, in our example “MAMMALIEN CELL DENSITY”. Fill in your name under “Created By” and optional you can fill in “Instructions” and/or “References” for your newly created method.
– Click “NEXT” and your method is created and acknowledged by an info message. Click “OK” in the info message. With this the process is completed and your new method is listed under “Measurement type” of the APP.
Using your custom calibration is fast and straightforward. Open the Photopette App and connect the device. Select your method under the list “Measurement type”. Perform the AUTOZERO in sterile cell culture media and with the same CuveTip measure directly in your cell sample. Done! From now on you will get highly accurate cell density data within less than a minute directly at your cell culture hood workplace.
2nd APPLICATION – PROTEIN/DNA/RNA CONCENTRATION
Photopette Bio allows the direct measurement of protein and nucleic acid (DNA, RNA) concentrations in less than a minute. No additional reagent is required.
A purified protein sample can be analyzed directly and quantified by measuring its optical absorbance at 280 nm (i.e. the “Protein A280 method”). This method does not require additional reagents or sample-prep or even generation of a standard curve for a known protein type. Please refer to our application note “MEASURING PROTEIN CONCENTRATION DIRECTLY USING PHOTOPETTE® BIO” at the Tip Biosystems webpage at www.tipbiosystems.com for details of the method.
A purified DNA sample can be analyzed directly and quantified by measuring its optical absorbance at 260 nm (i.e. the “DNA A260 method”). For pure DNA samples, the maximum absorbance occurs over a broad peak at around 260 nm; at 280 nm it only absorbs about half as much UV light compared to 260 nm. Please refer to our application note “DNA CONCENTRATION MEASUREMENT AT 260 nm USING PHOTOPETTE® BIO” at the Tip Biosystems webpage at www.tipbiosystems.com for details of the method.
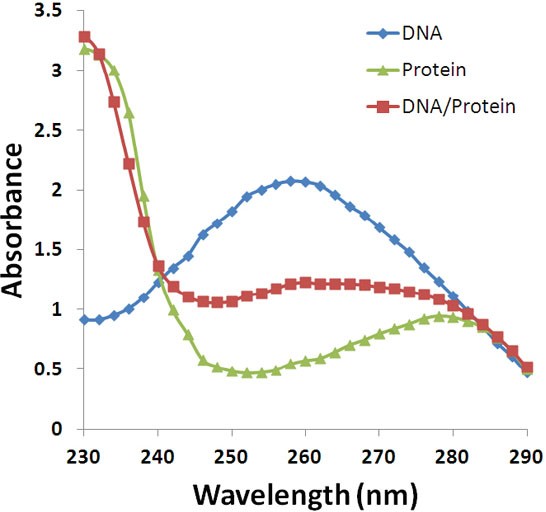
A typical UV absorbance spectrum for protein and DNA and its mixture is shown in Figure 5
As seen from Figure 5, the contamination of protein samples with DNA will increase the UV 280 absorbance and cause errors. For accurate measurements, the protein sample shall not contain other components such as nucleic acids or phenolic or aromatic components and vice versa DNA samples shall not contain proteins.
Upper measurement-limit
For Protein: By using the calibration curve for Photopette®, concentrations of up to ~8 mg/ml or protein (calculated for BSA) can be measured without dilution.
For DNA: The upper measurement-limit for DNA measurements is about 120 ng/µl or 120 µg/mL.
Limit of Detection (LOD) for Protein and DNA measurements
For Proteins: The limit of detection for direct protein measurement with Photopette® calculated by using a 3x Standard Deviation (SD) above the blank value is 0.023 mg/ml or 23 µg/ml.
For DNA: The limit of detection for direct DNA measurement with Photopette® calculated by using a 3x Standard Deviation (SD) above the blank value is 1.25 ng/μl.
3rd APPLICATION – CELL VIABILITY STUDIES
Photopette allows to perform cell viability assays directly within the cell culture hood. Cell-viability assays are important cell-based assays to determine whether cells are alive or dead. Such assays are widely used for investigating cell response to environmental factors such as viruses or drug or to establish relative cytotoxicity of chemicals.
Please refer to our application note “MEASURING CELL-VIABILITY BY RESAZURIN (ALAMARBLUE®) ASSAY USING PHOTOPETTE® CELL” at the Tip Biosystems webpage at www.tipbiosystems.com for details of the method. In brief, cell-viability is typically measured by determining innate metabolic activity using redox indicators. As long a cell maintains its reducing redox activity the cell is regarded as viable. Resazurin dye is used in redox based colorimetric assays to determine cellular metabolic reduction with minimal cell-toxicity. Living cells maintain a reducing environment within their cytoplasm and mitochondria. This reducing environment of living cells causes the Resazurin indicator (e.g. AlamarBlue® assay) to change from the oxidized-form (blue) to the reduced-form (red). By monitoring the absorbance at 570 nm and 600 nm with Photopette Cell, relative metabolic activity for the cells can be determined.
Discussion:
For highest accuracy in cell density measurements, a custom calibration of the respective cell line must be performed. The calibration curve will depend on the cell size and morphology which may be affected by the type of media and the cell culture parameters.
Purified protein and DNA samples can be directly measured at 280 nm and 260 nm respectively.
Details for all measurements presented in this application note can be found at the Tip Biosystems webpage at www.tipbiosystems.com.
Summary:
The Photopette® Bio, Cell and OD600 enable fast and convenient measurements directly in the cell culture hood. Measurements are directly performed within the hood and without sample transfer by using sterile CuveTipsTM. Measurements of cell density, protein and DNA/RNA concentrations are demonstrated.
If only cell density is required, we propose the lower-cost instrument Photopette OD600. Photopette Cell and Bio support a larger number of applications.
By using the “Method Maker” function of the Photopette app, an accurate calibration can be made for any cell line used in COVID-19 related research.
References:
[1] Shi-Hao Li, Abhinav Jain, Timo Tscharntke, Tobias Arnold and Dieter Trau, “Hand-Held Photometer for Instant On-Spot Quantification of Nucleic Acids, Proteins, and Cells”, Anal. Chem. 2018, 90, 4, 2564–2569 [2] “Photopette® User Manual V1.0.0” Tip Biosystems Pte Ltd, Singapore, 2016. [3] Quick Start Guide, Tip Biosystems webpage at URL www.tipbiosystems.com